The Personal Website of Mark W. Dawson

Containing His Articles, Observations, Thoughts, Meanderings,
and some would say Wisdom (and some would say not).
A Perspective on Statistics and Public
Polling
Introduction
This paper is a perspective on statistics. It is done by focusing on issues and concerns when utilizing statistics in decision making or formulating an opinion. As such, this perspective does not deal with the internal workings of statistical science and mathematics. The statistical information is presented in general terms understandable to a layman. For those wishing more details and/or mathematics, I have included a “Further Readings” section of books I would recommend that have more details and are readable by the general public.
I should point out that I am NOT a mathematician or statistician, nor have I received any education or training in the sciences. This paper is the result of my readings on this subject in the past decades. Many mathematicians and statisticians would critique what I have written here as not accurate nor through. I freely acknowledge that these critiques are correct. It was not my intentions to be accurate or through, as I am not qualified to give an accurate nor through description. My intention was to be understandable to a layperson so that they can grasp the concepts. Mathematicians and statisticians’ entire education and training is based on accuracy and thoroughness, and as such, they strive for this accuracy and thoroughness. I believe it is essential for all laypersons to grasp the concepts of statistics, so they make more informed decisions on those areas of human endeavors that deal with statistics. As such, I did not strive for accuracy and thoroughness, only understandability.
Figures
Can Lie, and Liars Can Figure
Knowing what is important, what is unimportant, and what is misleading when reviewing studies or statistics is crucial to discovering the truth. Unfortunately, statistics are often misused. Many times, this misuse is because people don’t understand statistics and its limitations. Sometimes, however, statistics are misused to lead people astray, so that they make incorrect decisions or formulate an ill-founded opinion. Sometimes this is by accident, and sometimes it is deliberate. Always remember when someone is utilizing statistics that “Figures Can Lie, and Liars Can Figure”, and you should cautiously review any statistics. Some brief thoughts on how to be cautious and careful about statistics follow.
Showoffs
Studies and Statistics are often co-dependent and presented together. They are different, however, as studies are a methodology for examining an issue, reasoning, and organizing based on the facts uncovered and reaching a logical conclusion. Statistics are often utilized in this process, and indeed, they are often essential to the process. Statistics, however, are often generated without a study and can stand on their own. It is quite common for commentators to say, “Studies Show” or “Statistics Show”, but you should never assume the studies or statistics are correct for the following reasons.
Studies
Show
Studies can show anything. For every study that shows something, there is another's study that shows the opposite. This is because every study has an inherent bias of the person or persons conducting the study, or the person organization that commissioned the study. A very good person conducting the study recognizes their biases and compensates for them, to ensure that the study is as accurate as possible. Having been the recipient of many studies (and the author of a few) I can attest to this fact. Therefore, you should be very wary when a person says, "studies show". You should always investigate a study to determine who the authors are, who commissioned the study and to examine the study for any inherent biases.
Statistics
Show
Everything that I said in "studies shows" also apply in statistics show. However, statistic show requires more elaboration, as it deals with the rigorous mathematical science of statistics. Statistics is a science that requires very rigorous education and experience to get it right. The methodology of gathering data, processing the data, and analyzing the data is very intricate. Interpreting the results of the data accurately requires that you understand this methodology, and how it was applied to the statistics being interpreted. If you are not familiar with the science of statistics, and you did not carefully examine the statistics and how they were developed, you can often be led astray. Also, many statistics are published with a policy goal in mind, and therefore should be suspect. As a famous wag once said, "Figures can lie, and liars can figure". So be careful when someone presents you with statistics. Be wary of both the statistics and the statistician.
Issues
and Concerns
Correlation
vs. Causality
One of the major issues with statistics that you should be aware of, especially when a politician starts quoting statistics to support their policy position, is the problem of Correlation vs. Causality. Correlation is when two or more statistics are compared, and they seem to be in sync, especially when they are graphed. A Causality occurs when two or more statistics are related, and a change in one or more of the statistic affects the other(s) statistic. But as statisticians are trained “Correlation does not imply Causation” as exemplified in the following statistical graph:

UU Spending on Science, Space, and Technology
vs.
Suicides by hanging, strangulation, and suffociation

Honey producing bee colonies (US)
vs.
Juvenile arrest for possession of marijuana (US)
(from Spurious Correlations)
Both statistics correlate (having the same or mirror graphs), but neither has any causation on each other. These examples are extreme, but most Correlation vs. Causality issues are much subtler. Whenever you are presented with a statistic you should carefully consider the Correlation vs. Causality issue that it may contain.
Incorrect
Utilization
An example of utilizing statistics improperly is Calendar Time vs Labor Effort. While I was awaiting my security clearance at GE Aerospace it took almost seven months for me to receive my clearances. This was not because it took seven months to investigate my background, but it took six months to start the processing of my application. Once my application was started it only took about a week to perform the work to process the application. Therefore, the labor effort was one week, but the calendar time was seven months. The important statistic was the labor effort, while the calendar time was only an indication of the administrative backlog. If someone had only mentioned the calendar time you would have thought that this was an excessive amount of time to do the work. The labor time was the important fact to determine the work required to process an application.
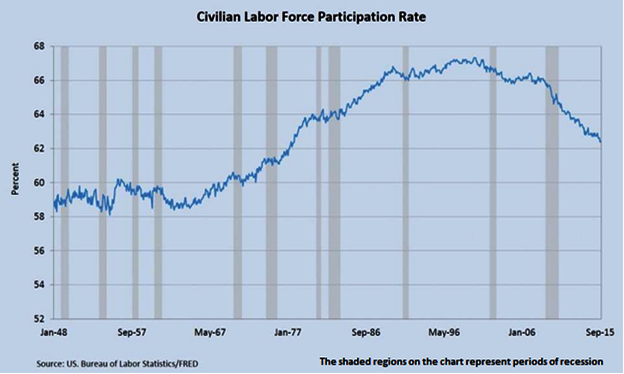
Another example is using only one statistic when two or more statistics are required to gain a fuller understanding of the actual situation. This is best shown in the example of employment within the United States. To better understand employment in the United States you need to know of the people who are without a job and looking for a job (The Unemployment Rate), and the people who are without a job and have given up looking for a job (The Underemployment Rate). Many people go back and forth between these categories, and you need to be aware of both rates to truly determine the employment rate within the United States. Very often the change in one rate influences a change in the other rate, and both rates are needed to determine employment within the United States. The following charts exemplify this:

As can be seen in the above chart the number of people who are not working in the United States can vary between 10 and 20 percent. And it is important that we know the total number of people without work so that we can provide them with the proper social services (mostly food and housing) while they have no work. Combining these and other factors you get the Civilian Labor Force Participation Rate. This rate shows what percentage of the U.S. Population is currently employed as follows:
As can be seen from this chart you can obtain a better perspective of employment within the United States. This chart, of course, can be analyzed with additional statistics, and be broken down into finer detail for a more comprehensive analysis. You must be careful in obtaining the proper statistics to determine your objective. This is more apparent in the following example.
Statistics are often utilized to justify a future trend, but Statistics only provide a guide to what has happened, and what may happen. But they are open to interpretation, and this interpretation must be done with care, responsibility, and honesty (and often by highly statistically trained individuals) Probabilities are less open to interpretation and are usually wrong when the data being utilized is incorrect, or the algorithms being utilized are incorrect (Boolean logic or arithmetic operation is wrong). Therefore, one must always be careful and skeptical when utilizing statistics and probability to discuss an issue.
Probability
or How likely something is to happen?
Many events can't be predicted with total certainty. The best we can say is how likely they are to happen, using the mathematics of probability. Just because something has statistically happened doesn’t mean that it will probably happen. A good example is the flip of a coin. Let’s say that you have flipped a coin nine times – and seven times it has come out heads and two times it has come out tails. Statistically speaking the tenth coin flip would probably come up heads. But this is not the case. Probability states that if there are only two outcomes (heads or tails) the probability of an outcome is 50-50, and you can’t know the outcome until you flip the coin. This probability also applies to multiple possible outcomes (like the roll of dice). I would recommend the website Math Is Fun to obtain more information.
The issue here is “Probability vs. Probably”. The words are very similar and are often used interchangeably, but they shouldn’t be interchanged. Probability is a mathematically rigorous endeavor, while Probably is just a likely guess. So be careful when you review statistical conclusions that they didn’t utilize “Probably” in their conclusion.
Interrelationships
You must also examine the interrelationships between the various statistics, their causation, and the importance of each relationship (a weighted factor). An example of this is opposing posters that were circulated on the Internet a few years ago:

|

|
All of the statistics on both of these posters are true. But there are unreported statistics as well, and one side only gives the favorable statistics, while the other side gives the unfavorable statistics. It is easy to believe the statistics that support your worldview, and easy to discount the statistics the contravene your worldview. But for an accurate worldview, you must consider all of the statistics (both pro and con) before forming or changing your worldview. A more complete picture of the facts on the above posters is as follows:

Even the above chart does not reveal the whole truth. The above poster shows different blocks of statistics but doesn’t show the interrelationships nor the causations between the blocks, nor the weighted impact of changes within the blocks that would affect the other blocks. You must always consider these interrelationships and effects to help you determine the true state of affairs.
Of course, you also need to statistically analyze these numbers as to their cause and effect, contributing factors, and government policy & regulation impacts. Even then you cannot get a complete or accurate representation of the truth, as there are too many constants and variables, interactions between the constants and variables, and perhaps insufficient time for the actual results to be measured. Again, one must always be careful and skeptical when utilizing statistics to discuss an issue.
Sampling,
Sample Bias, and Conclusions
Who and what you choose to sample to develop your statistics can impact your results or lead you to a wrong conclusion. An example of this is a recent University of Iowa study of its students to determine What Men and Woman want in a life partner. They studied their students and gather statistics as to what their students wanted or didn’t want in in a partner. I have no doubt as to the veracity of this study, but I have serious doubts about the appropriateness of their conclusions. First the results of their study:

The first problem is that they polled their student body, a student body who had spent most of their life in an academic environment (K-12 & College). This study sample makes no allowance for non-academic experience in a normal personal or work environment that we all know has a significant impact on our attitudes and values. Or as Mark Twain once said:
“When I was sixteen I thought that my father was the dumbest most ignorant man in the world. And when I turned twenty I was amazed how much he had learned in four short years.”
Therefore, this study was only appropriate for College students and has little bearing on what an adult may think after a few years in a non-academic environment.
The other problem with this study is that modern medical science knows that a human brain does not fully mature until sometime between the year's twenty-two and twenty-four. And the last part of the brain that develops is the center that makes judgments based on possible future consequences of your actions. That is why most young people behave in a wild and crazy manner – their brain has not developed sufficiently to control their actions. Therefore, this study is utilizing an immature brain as its sample group. Who knows what judgments may change after the brain is fully mature.
There is also the question of self-serving and bias answers. Take the last category “Unimportant characteristics”. The Chastity answer begs the question “Are the men answering this way to convince the woman that sexual promiscuity is acceptable?” and “Are woman answering this way to condone their own sexual behavior?”. It would have been a much more meaningful statistic if it were broken down by students who were virgins, students with 1 to 3 sexual partners, students with 4-9 sexual partners, and students with ten or more sexual partners. A breakdown of the sexuality of the students (heterosexual, homosexual male, homosexual female, bi-sexual, etc.) is also necessary. It should also be broken down by students that identify themselves by ideology (conservative, moderate, liberal, leftist), as well as religiosity (strongly religious, mildly religious, no religiosity, or agnostic or atheistic). You could then judge the weight of this answer based on these backgrounds.
The “Similar political background” answer also needs to be broken down to students that identify themselves by ideology (conservative, moderate, liberal, leftist), as well as religiosity (strongly religious, mildly religious, no religiosity, or agnostic or atheistic), and other possible categories.
The other categories also have the same types of questions as too self-serving and bias answers. Not having read the study (I couldn’t find the actual study, but I found the graphic being touted by special interest groups), I do not know if any of these items were broken down, and in which ways they were broken down. This is why a synopsis or simple graphic of a study or statistic is not a good basis for making a judgment. Reviewing the conclusions of a study or a graphical representation of the statistics is no substitute for examining the actual study or statistics.
To be truly useful this study also needs to have a follow-up of five, ten, fifteen, and twenty years after the original study was performed, with the original students who were studied. You could then study if they were married and/or divorced, had children, their socio-economic status, and other factors that may have changed their opinions. Such a study and follow-up would then be very useful to determine what men and woman really want in a life partner.
Given the above, it can be seen that this study is only useful for people in a constricted environment (academics) with immature brains. It probably has little basis for a mature person with life experiences and a fully developed brain. As such it should only be utilized for analysis within its constricted study sample.
Tangential
Issues
Chaos,
Complexity, and Networks
What do chaos, complexity, and networks have to do with studies and statistics? Directly Nothing – Indirectly Everything! If you are going to utilize statistics and probability to make a decision or formulate an opinion then you need to be aware of chaos, complexity, and networks. We first need to understand something of chaos, complexity, and networks to understand their impact on studies and statistics.
When Economist, Statisticians, Politicians, Sociologist, Businessman and others who deal with human decisions by individuals or groups they need to be cognizant that there are many, many, factors that go into those individuals or groups decisions (the initial conditions). Some of these initial conditions may even be unknown, unnoticed or unaccounted for, including by the individuals or groups making the decision. And when circumstances change the decisions of individuals or groups can change. A change in the decisions of even a small group (or an individual) can propagate throughout the network and alter other individuals or groups in the network decision-making processes, which can then change the originators and other individuals or groups decisions within the network. This is known as network feedback, which changes the entire dynamic of the network.
Within the individuals or groups, there is also the initial conditions and the feedback that occurs. If the initial conditions and feedback are not precisely known, then you cannot predict the outcome of the system. This is known as the complexity of the system. Complexity also states that if the minor initial starting values are not precisely known it can cause big differences in where things end up. Adding imprecisely known feedback values into the system adds to this problem. Therefore, if your statistics are not precise (which they rarely are), and imprecise feedback is present, it is difficult to predict a precise outcome. Indeed, it often leads to Chaos.
The changes to the network, and complexity, can then lead to Chaos. Chaos states that small differences in initial conditions (such as those due to rounding errors in numerical computation) yield widely diverging outcomes. Chaos can also occur due to imprecise feedback values. Chaos can cause large unexpected changes to occur in a system. And in human interactions, these changes could be significant (such as an economic collapse or even a war).
Therefore, statistics and probability cannot be accurate, especially in human interactions. For non-human interactions, for example, consider the Network of our Solar System and its Planets. For the Network of our Solar System and its Planets. Einstein’s General Theory of Relativity can predict the revolutions of the Planets around the Sun. However, the Planets interact gravitationally with each other as well as with the Sun. As the precise gravitational figures of the Sun and Planet Masses, as well as the precise distances between the Sun and the Planets, and the precise velocities of the Planets are not known, the Network becomes unstable. As Complexity builds up Chaos will be the result, and our predictions of the orbits will fail. The actual Planetary orbit can also change due to the unknown, unnoticed or unaccounted for factors (such as minor planets, asteroids, meteorites, comets, or another unknown mass passing by our Solar System). Our predictions are accurate for tens or hundreds of millions of years, but sometime in that timescale, the orbital prediction will no longer be accurate. The Planetary actual orbits can also change due to the unknown, unnoticed or unaccounted factors. Thus, Network science, Chaos and Complexity is embodied in our Solar System in both a predictive and actual manner.
Chaos
theory
Chaos theory is the field of study in mathematics and science that studies the behavior and condition of dynamical systems that are highly sensitive to initial conditions, a response popularly referred to as the butterfly effect (Does the flap of a butterfly’s wings in Brazil set off a tornado in Texas?). Small differences in initial conditions (such as those due to rounding errors in numerical computation) yield widely diverging outcomes for such dynamical systems, rendering long-term prediction impossible in general. This happens even though these systems are deterministic, meaning that their future behavior is fully determined by their initial conditions when no random elements are involved. In other words, the deterministic nature of these systems does not make them predictable. This behavior is known as deterministic chaos, or simply chaos. The theory was summarized by Edward Lorenz (who discover it) as:
Chaos: When the present determines the future, but the approximate present does not approximately determine the future.
One meteorologist remarked that if the theory were correct, one flap of a sea gull's wings would be enough to alter the course of the weather forever. The controversy has not yet been settled, but the most recent evidence seems to favor the seagulls. Chaotic behavior exists in many natural systems, such as weather, climate, geology, celestial mechanics, and quantum theory. This behavior can be studied through analysis of a chaotic mathematical model, or through various analytical techniques. Chaos theory has applications in several disciplines, including meteorology, sociology, physics, computer science, engineering, economics, biology, and philosophy. What this means is that every so often, and at unknown times, the scientific predictions do not match the actual result. Edward Lorenz summarized his thoughts on Chaos as follows:
- Chaos does not only arise out of complexity, it arises even out of simplicity.
- Chaos doesn't usually emerge slowly, it leaps out at you.
- Chaotic behavior appears to be random, but isn't really.
The following is Lorenz Diagram of a simple chaotic system:

Complexity
Complexity characterizes the behavior of a system or model whose components interact in multiple ways and follow local rules, meaning there are no reasonable means to define the various possible interactions. Complexity arises because some systems are very sensitive to their starting conditions so that a tiny difference in their initial starting conditions can cause big differences in where they end up. And many systems have a feedback into themselves that affects their own behavior, which leads to more complexity. Therefore, sensitivity and feedback lead to chaos and complexity, which leads to unpredictability (very unscientific). This can be seen in the diagram below.

Network
science
Network science is an academic field which studies complex networks such as telecommunication networks, computer networks, biological networks, cognitive and semantic networks, and social networks, considering distinct elements or actors represented by nodes (or vertices) and the connections between the elements or actors as links (or edges). Network science draws on theories and methods including graph theory from mathematics, statistical mechanics from physics, data mining and information visualization from computer science, inferential modeling from statistics, and social structure from sociology. The United States National Research Council defines network science as "the study of network representations of physical, biological, and social phenomena leading to predictive models of these phenomena. The science of networking has taken tremendous strides in the last two decades, as advanced computers have allowed the modeling of networks. However, networks are very complex with many interactions and have many unknown, unnoticed or unaccounted for connections. Changes in one node of the network will ripple throughout the network and could affect large changes in other nodes of the network which then feedbacks into the network. Statistical models may be inaccurate because they exist inside a network in a node or link which may be unaccounted for in other nodes or links.

Closing
Thoughts:
All statisticians need to be aware of Chaos Theory, Complexity, and Network science when analyzing the results of their statistics, and especially their predictive (computer) models. Chaos Theory, Complexity, and Network science also reminds us that we live in a problemistic, and not deterministic, universe.
More information on these items can be found on the Wikipedia articles on Chaos, Complexity, and Network science, as well as my recommendation in Further Readings.
The
Law of Unintended Consequences
The law of Unintended Consequences is something that I have
been very concerned about, ever since I found out about it. I have
seen it operate so many times, and in so many ways, that although it
is an economic and social law (which are often highly inaccurate) I
believe that it is a cornerstons of economic and social science, and
very applicable to political science.
The law of unintended consequences, often cited but rarely defined, is that actions of people—and especially of government—always have effects that are unanticipated or unintended, in its outcomes of unexpected benefits, unexpected drawbacks, and perverse results. Economists and other social scientists have heeded its power for centuries; and for just as long, politicians and popular opinion have largely ignored it. Most often, however, the law of unintended consequences illuminates the perverse unanticipated effects of government legislation and regulation. This law is also a great contributor to the public policy aphorism “Every public policy problem has a simple solution – and it’s usually wrong.”
Unintended consequences can be grouped into three types:
- Unexpected benefit: A positive unexpected benefit (also referred to as luck, serendipity or a windfall).
- Unexpected drawback: An unexpected detriment occurring in addition to the desired effect of the policy (e.g., while irrigation schemes provide people with water for agriculture, they can increase waterborne diseases that have devastating health effects, such as schistosomiasis).
- Perverse result: A perverse effect contrary to what was originally intended (when an intended solution makes a problem worse). This is sometimes referred to as 'backfire'...
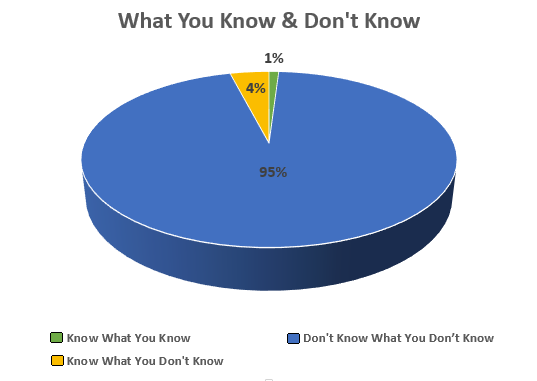
I would also add, upon thinking about the law of Unintended Consequences, that is very important to remember three things:
- That we know what we know,
- That we know what we don't know,
- That we don't know that we don't know.
It is that we don't know that we don't know that often is the killer in the Law of Unintended Consequences.
The percentages of these items are often staggering as follows:
When crafting any social, economic, or political policy you should always remember what Ben Franklin said - “Doubt a little of your own infallibility” when crafting and reviewing the policy.
A good introduction to this topic is The Concise Encyclopedia of Economics article on Unintended Consequences.Common
Sense
Most people would resort to common sense when reviewing political polls, but common sense can lead you astray. What most people mean by "Common Sense" is common knowledge and sensible responses. But common knowledge may not be so common amongst many people, or sensible responses may differ among reasonable people.
Common knowledge is not so common as each person has a different breadth and depth of knowledge. The knowledge, education, and experience of each person differ. As such, each person may reach a different conclusion than another person. This does not necessarily make someone wrong if they disagree with you. Most often if you politely discuss the disagreement you may often come to a common agreement, or modify your or the others opinion, or simply agree to disagree. But you should always keep in mind that you may be wrong, and you should be open to change your conclusion.
Sensible responses are different amongst people, as each person has their own priorities and judgments of the importance of an issue. Sometimes people place more importance on their personal goals, while others may place more importance on the social goals. And even within the goals, there are different priorities. They weigh the criteria to determine the sensible response, with each person putting different weights on each criterion, and then have a sensible response based on their criteria, which may (and possibly will) be different than another person's response. Until you discuss the criteria and weights you cannot know the reason for the other person's response. Therefore, do not be quick to judge another's response as it may be perfectly reasonable from the perspective of the other person. Again, politely discussing the response will help you better understand the other person.
Common sense is most appropriate in our social interactions with each other. We grow up and learn how to treat each other (such as politeness and common courtesies) within our cultural norms. This is one of the best purposes of common sense, and indeed we could not function as a society without this type of common sense. So, what do I mean by common sense in public polling?
My personal usage of common sense in public polling is to utilize my understanding of human nature and our cultural norms. I then obtain as much knowledge as possible from intelligent, knowledgeable and experienced subject matter experts (especially those that I may disagree with), and then apply formal and informal logic to what I have learned to reach my own conclusions. I also allow for the possibility that I may be wrong, and to try to determine the consequences of my being right or wrong. I then reach what I consider a reasonable conclusion on the sensibility of the public poll. This is how I utilize Common Sense when reviewing public polls.
Public
Polling
Political polling has become ubiquitous and nefarious in today’s society.
Ubiquitous because no matter how inane, vacuous, unimportant, or insignificant the poll maybe there are people and organizations that will poll the subject. And there will be a hubbub over the results. This is not much of a concern of mine, as people and groups are free to do whatever they choose with their time and monies, and I am free to ignore these polls.
Nefarious, however, is a big concern of mine. It is well established that the wording of the questions, the order in which they are asked, and the number and form of alternative answers offered can influence results of polls, and therefore influence public policy.
Statistical
Methods of Polling
The statistical methods utilized to create a public poll also has many inherent problems. Coverage bias is a source of error involving the use of samples that are not representative of the population due to the polling methodology. This has become even more a problem as technology has made it more difficult for the pollsters to reach a representative sample of the public. At the beginning of polling, most public polls were by telephoning a person at their home. Many people participated in these polls if they had the time and inclination to do so. However, today, home telephones are dwindling as people switch to using their cell phones. While using your cell phone you may be at work, out in about walking or shopping or engaged in other activities that you do not want to be interrupted. With the increased use of text messaging and social apps for communication, this problem is getting worse. Therefore, not as many people are participating in a poll, and those that do are not a true representative sample.
Self-selection bias arises in any situation in which individuals select or unselect themselves into/from a group, causing a biased sample with non-probability sampling. Polls also have the potential for inaccuracy in non-response bias or response bias. This occurs when someone does not answer or improperly answers a question. Many people simply refuse to involve themselves in a poll, and they do this for many reasons. They may not believe in polling, or they believe the poll or pollster is biased, and they will not get involved in polling. If they do become involved in the polling they may answer the poll question on not what they think or feel, but on what they believe the pollster thinks or feels (sympathetic response). They may also answer the question inaccurately because they feel that they may be disparaged for their answer. This is especially true in a politically correct environment as many people become reluctant to provide a non-politically correct opinion.
Pollsters attempt to correct for these situations by making statistical corrections using various statistical techniques. However, the question then becomes are these statistical corrections valid, or are they a reflection of pollsters’ biases or prejudices.
The perfect example of these inherent problems with polling was in the Presidential election of 2016. Practically all the pollsters predicted that there was no possibility of Donald Trump defeating Hillary Clinton. Yet Donald Trump was the victor. Prior to the election political pollsters informed us that there was no way the Donald Trump could win the election. In one case a pollster informed us that Hillary Clinton had a 98 percent chance of winning the general election. Most (if not all) pollsters said that there was no chance that Donald Trump could win the necessary 270 electoral votes needed to win the election. But an election is the only accurate poll worth considering. Despite these pollsters, Donald Trump is the 45th President of the United States (by a wide margin in the electoral votes). And despite these inaccurate polls the pollsters are continuing to report on the opinions of the American people regarding Donald Trump’s popularity and policy positions.
It should also be noted that Hillary Clinton relied extensively on polls and their analytics to determine her campaign strategy. The problem is that if the polls were incorrect then the analytics would be incorrect, and the campaign strategy would, therefore, be faulty. And so it was, and Hillary Clinton lost the election, in part, due to an over-reliance on public polls.
Given the failure of pollsters in the 2016 Presidential Election it is proper to ask if the pollsters are correct or incorrect in their political polls after the election of Donald Trump. Pollsters would answer that they have changed their statistical corrections based on what they learned from the election. However, I am dubious, as their statistical correction is but guesstimates, and they may be wrong guesstimates. In addition, society has become more polarized and pollsters may not be able to make accurate guesstimates because of this polarization.
A good overview on political polling is the Brookings Institute articles on “Polling & Public Opinion: The good, the bad, and the ugly” and “Can We Trust the Polls?: It all depends”.
Polls also have a host of other problems. Entire books have been written on the problems of political polling. For these reasons, a poll can be conducted with nefarious intentions and inaccurate results. I will not go into any of these problems, as it is beyond the scope of this article. I will instead focus on two major nefarious issues that are my pet peeves on the utilization of political polls; polling the ignorant, and the proper utilization of polls.
The
Village Idiot
Political polling is done with a representative sample of the population. As such this sample only captures the sentiments and feelings of those sampled, as very rarely are the people that are being sampled have a knowledge or experience of the subject that is being polled. Therefore, when a pollster asks what a person thinks they are usually getting what a person feels.
Feelings are a poor method of crafting public policy decisions. Or as Warren Buffett has said:
"A public-opinion poll is no substitute for thought."
- Warren Buffett
When polling people you cannot know their scope of knowledge or experience on the subject. You could be polling the village idiots or the village wise men. Therefore, the results of the political polling will often not be a good basis for setting public policy.
When reviewing political polls you should keep in mind an ancient Chinese proverb:
“A wise man makes his own decisions, an ignorant man follows public opinion”
Utilization
of Polls
Which brings us to the proper utilization of polls. Political polls are often utilized to mold public opinion and influence public policy. However, this results in two important issues when developing public policy.
Think
vs. Feel - or - Emotions are Easy, Thinking is Hard
Many (if not most) of today's political debate is about feelings. But feelings do not make for good policy. Facts, intelligence, and reasoning should be utilized to create policy, with feelings being used as a supplement to thinking. The difference is that feelings are emotionally based, while thinking is reason based. But emotions are easy, while thinking is hard. Always remember that the only good way to create public policy is by an open and honest discussion of the issues based on facts, intelligence and reasoning (reasoned based). All sides of an issue should be heard and debated to assure that the best public policy is implemented. To do so otherwise often creates more problems than it solves. Doing so also reduces "The Law of Unintended Consequences", as discussed previously.
With
Facts, Intelligence, and Reasoning
Facts should be utilized with intellectual reasoning to determine the truth. To do otherwise would abrogate the truth and lead you into misjudgments. To allow emotions into your facts and reasoning will also lead to a falsehood. You must, however, obtain all the facts before you apply intelligence and reasoning. This requires that you listen and read all sides of an issue, not just the side you agree with. You need to winnow out the facts to determine their applicability, their importance, and their usefulness to your reasoning. You must also weigh the facts in their importance and give more credence to the more important facts in your reasoning. Intelligent reasoning then requires that you apply formal and informal logic to the remaining facts. At the end of this process, and not before, you can claim your decision is based on facts, intelligence, and reasoning.
However public sentiment is very important in the crafting of public policy. To craft public policy which goes against the sentiment of the public is not wise, as it will often not be supported by the public. As Abraham Lincoln noted:
“In this age, in this country, public sentiment is everything.
With it, nothing can fail; against it, nothing can succeed.
Whoever molds public sentiment goes deeper than he who enacts
statutes, or pronounces judicial decisions.”
- Abraham Lincoln
Misuse
of Public Opinion Polls
Many people are trying to utilize political polling to shape public policy decisions. But making good public policy decisions requires more than public opinion. Or as a famous Greek philosopher has stated:
"Just as it would be madness to
settle on medical treatment for the body of a person by taking an
opinion poll of the neighbors, so it is irrational to prescribe
for the body politic by polling the opinions of the people at
large."
- Plato
Politicians should utilize public polling to guide them in how to best explain their reasoning for the public policy, and as a means to change public sentiment. As Ronald Reagan has been quoted as saying:
"I utilize polls to determine how
much convincing I need to do".
- Ronald Reagan
Any politician who utilizes political polling to determine public policy is doing a disservice to their country, as stated in the following two quotes about the utilization of political polling:
"I did not enter the labor Party
forty-seven years ago to have our manifesto written by Dr. Mori,
Dr. Gallup and Mr. Harris."
- Tony Benn
"If you are guided by opinion polls,
you are not practicing leadership -- you are practicing
followership."
- Margaret Thatcher
Political
Polling Conclusions
Whenever political polling is being utilized you should always:
- Beware the Poll Takers
- Beware the Poll Results
- Beware the Poll Utilizers
Or, you can do what I generally do:
- Ignore the Public Polls.
- Assume the Polls are Probably Inaccurate.
- Remember - Things Change - So will the Public Polls.
Final
Thoughts
We should also keep in mind the words of Alexander Pope -in “An Essay on Criticism”.
“A little learning is a dangerous
thing
Drink deep, or taste not the Pierian spring:
There shallow draughts intoxicate the brain,
And drinking largely sobers us again.
Fired at first sight with what the muse imparts,
In fearless youth we tempt the heights of arts
While from the bounded level of our mind
Short views we take nor see the lengths behind
But more advanced behold with strange surprise,
New distant scenes of endless science rise!”
Note - In Greek mythology, the Pierian Spring of Macedonia was sacred to the Muses, as the metaphorical source of the knowledge of art and science.
Therefore, examine statistics very carefully and with a critical attitude before utilizing them.
Further
Readings
For a brief introduction on these topics I would recommend the Oxford University Press series “A Very Short Introduction” on these subjects:
- Probability: A Very Short Introduction, by John Haigh
- Statistics: A Very Short Introduction, by David J.Hand
- Chaos: A Very Short Introduction, by Lenny Smith
- Complexity: A Very Short Introduction by John H. Holland
- Networks: A Very Short Introduction by Guido Caldarelli
For more detailed information on these topics I would recommend the following books:
- "That Which is Seen and That Which is Not Seen", "The Law", and "Government" by Frederic Bastiat
- Everything is Obvious – Once You Know the Results by Duncan J. Watts
- Naked Economics: Undressing the Dismal Science (Fully Revised and Updated) By Charles Wheelan
- Naked Money: A Revealing Look at What It Is and Why It Matters
By
Charles Wheelan - Naked Statistics: Stripping the Dread from The Data by Charles Wheelan
- Studies Show: A Popular Guide to Understanding Scientific
Studies” By
John H. Fennick - The Armchair Economist – Economics and Everyday Life (2nd Edition) by Steven E. Landsburg
- The Art of Statistics: How to Learn from Data by David Spiegelhalter.