The Personal Website of Mark W. Dawson

Containing His Articles, Observations, Thoughts, Meanderings,
and some would say Wisdom (and some would say not).
Oh What a Tangled Web We Weave
When first we practise to deceive!
- Sir Walter Scott
Figures
Can Lie, and Liars Can Figure
Knowing what is important, what is unimportant, and what is misleading when reviewing studies or statistics is crucial to discovering the truth. To repeat my comments on “Studies Show” and “Statistics Show” in my observation on “Phrases”:
Studies
Show
Studies can show anything. For every study that shows something, there is another's study that shows the opposite. This is because every study has an inherent bias of the person or persons conducting the study, or the person organization that commissioned the study. A very good person conducting the study recognizes their biases and compensates for them, to ensure that the study is as accurate as possible. Having been the recipient of many studies (and the author of a few) I can attest to this fact. Therefore, you should be very wary when a person says "studies show". You should always look into a study to determine who the authors are, who commissioned the study and to examine the study for any inherent biases.
Statistics
Show
Everything that I said in "studies shows" also apply in statistics show. However, statistic show requires more elaboration, as it deals with the rigorous mathematical science of statistics. Statistics is a science that requires very rigorous education and experience to get it right. The methodology of gathering data, processing the data, and analyzing the data is very intricate. Interpreting the results of the data accurately requires that you understand this methodology, and how it was applied to the statistics being interpreted. If you are not familiar with the science of statistics, and you did not carefully examine the statistics and how they were developed, you can often be led astray. Also, many statistics are published with a policy goal in mind, and therefore should be suspect. As a famous wag once said, "Figures can lie, and liars can figure". So be careful when someone presents you with statistics. Be wary of both the statistics and the statistician.
Studies and statistics often claim to be scientific and rigorous. However, most of them are not as scientific or as rigorous as we may believe. Most studies are based on statistics, and most statistics become studies. But most studies based on statistics have issues with data, methodology, correlation and causality, sampling, and confidence level, not to mention risk factors and probabilities, along with a host of other issues.
Lies,
Damn Lies, and Statistics
Benjamin Disraeli once famously said, "There are three kinds of lies: lies, damned lies, and statistics."
However, there are actually four kinds of lies: mistakes, lies, damned lies, and statistics.
Mistakes are when you have said something that you believe to be true, but later discover it was untrue. After the discovery of your mistake, you have a moral responsibility to correct the record with those who you had misinformed.
Lies make the world go around. They are told to protect the feeling of others or to prevent embarrassment to ourselves. They should only be told if no harm comes from them. Otherwise, they will become Dammed Lies.
Dammed Lies are told to gain an advantage for ourselves or to demonize, denigrate, or disparage an opponent. They are despicable, and when discovered they the teller should be roundly condemned.
It has been said the "Figures Can Lie, and Liars Can Figure." Statistics are often utilized to justify a belief, but Statistics only provide a guide to what has happened, and what may happen. But they are open to interpretation, and this interpretation must be done with care, responsibility, and honesty (and often by highly statistically trained individuals) Probabilities are less open to interpretation and are usually wrong when the data being utilized is incorrect, or the algorithms being utilized are incorrect (Boolean logic or arithmetic operations are wrong). Therefore, one must always be careful and skeptical when utilizing statistics and probability to discuss an issue.
Finally, the other important issue with studies and statistics is knowing what you know, knowing what you don't know, and allowing for what you don't know that you don't know. A good analyst or statistician always points out what they can be certain of, of what they are uncertain of, and that they may be unaware of all the facts or circumstances that could potentially skew their results. A bad analyst or statistician will often obscure these factors in order to achieve the desired results.
The following observations are a few examples that demonstrate how you must be careful when examining statistics.
The Importance of Data
All Studies and Statistics rely on data. The data must be as thorough and accurate as possible for the studies and statistics to be meaningful. In addition, the data and the methodology (i.e., Data Mining, Data Massaging, and Data Quality) utilized to analyze the data that goes into the studies and statistics must be made available to others to verify the veracity of the studies and statistics. This data and methodology release will allow others to discover possible mistakes the researchers made have made or to verify the veracity of the studies and statistics. For a researcher to withhold the data or the methodology is to automatically make the studies and statistics suspect, and it is considered fraud in academia when data or methodology is withheld.
However, there is simply no way that data alone can provide a genuine full picture of reality. There will always be holes. It will always be late. There will always be mistakes. There will always be uncertainties over causality. Moreover, all data represents a snapshot in time and can prove extremely misleading with changes over time. You should also remember the words of wisdom by another author of statistics and probabilities books:
"If you torture the data long enough,
it will confess to anything."
- from Darrell Huff's book "How to Lie With Statistics"
(1954)
Some of the other problems with data and methodology are as follows.
Correlation vs.
Causality
One of the major issues with statistics that you should be aware of, especially when a politician starts quoting statistics to support their policy position, is the problem of Correlation vs. Causality. Correlation is when two or more statistics are compared and they seem to be in sync, especially when they are graphed. A Causality occurs when two or more statistics are related, and a change in one or more of the statistic affects the other(s) statistic. But as statisticians are trained “Correlation does not imply Causation”.
Where there is a substantial correlation between A and B, this might mean that:
- A causes B.
- B causes A.
- Both A and B are results of C, or some other combination of factors.
- It is a coincidence.
In most cases the correlation is a because of #3 or #4, and a good statistician will do extensive research and data examination before claiming #1 or #2.
This can be humorously illustrated by the following statistical graphs:
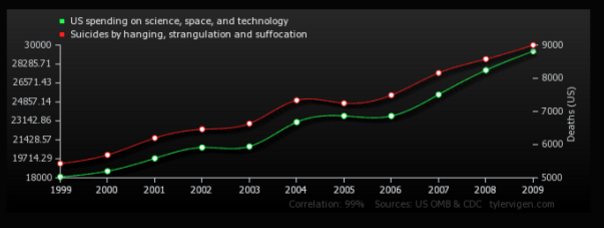
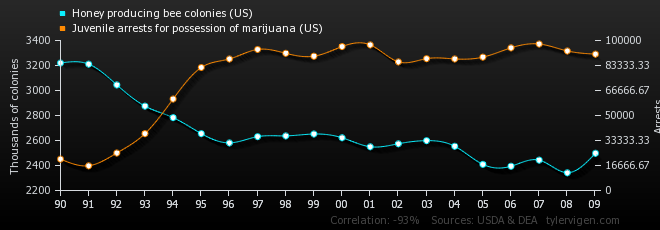
Both statistics correlate, but neither has any causation on each other. These examples are extreme, but most Correlation vs. Causality issues are much subtler. Whenever you are presented with a statistic you should carefully consider the Correlation vs. Causality issue that it may contain.
For more on this subject refer to the Economic section of my “Further Readings”.
Using
Figures and Studies Inappropriately – Part I
An example of using figures and studies inappropriately is of the opposing posters that were circulated on the Internet a few years ago:
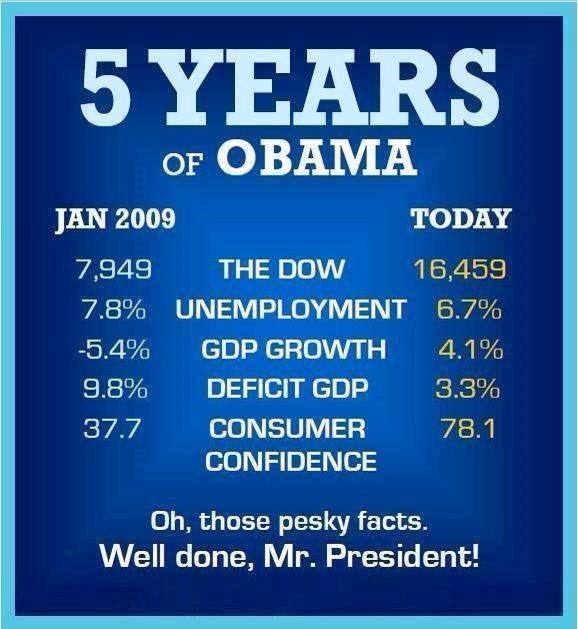

All of the statistics on both of these posters are true. But there are unreported statistics as well, and one side only gives the favorable or statistics, while the other side gives the unfavorable statistics. There is also the cherry-picking of statistics, and when to start and stop collecting statistics (in the above example the starting points were in the depths of an economic recession, and the endpoints were during an economic recovery). It is easy to believe the statistics that support your worldview, and easy to discount the statistics the contravene your worldview. But for an accurate worldview, you must consider all of the statistics (both pro and con) before forming or changing your worldview. A more complete picture of the facts on the above posters is as follows:
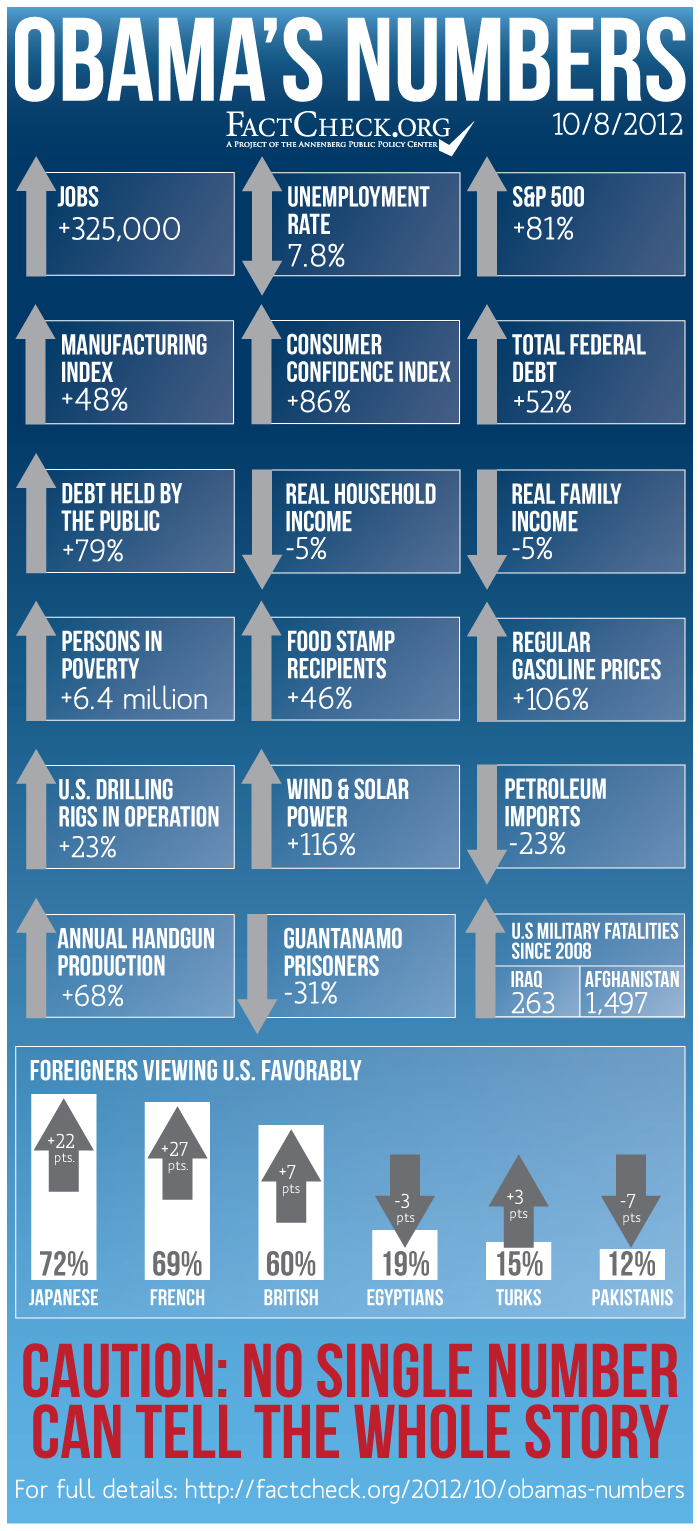
Even the above chart does not reveal the whole truth. The above poster shows different blocks of statistics but doesn’t show the interrelationships between the blocks, nor the impact of changes within the blocks that would affect the other blocks. You must always consider these interrelationships and effects to help you determine the true state of affairs.
Of course, you also need to statistically analyze these numbers as to their cause and effect, contributing factors, and government policy & regulation impacts. Even then you cannot get a complete or accurate representation of the truth, as there are too many constants and variables, interactions between the constants and variables, and perhaps insufficient time for the actual results to be measured. Again, one must always be careful and skeptical when utilizing statistics to discuss an issue.
Using
Figures and Studies Inappropriately – Part II
Another example of utilizing statistics improperly is Calendar Time vs Labor Effort. While I was awaiting my security clearance at GE Aerospace it took almost seven months for me to receive my clearances. This was not because it took seven months to investigate my background, but it took six months to start the processing of my application. Once my application was started it only took about a week to perform the work to process the application. Therefore, the labor effort was one week, but the calendar time was seven months. The important statistic was the labor effort, while the calendar time was only an indication of the administrative backlog. If someone had only mentioned the calendar time you would have thought that this was an excessive amount of time to do the work. The labor time was the important fact to determine the work required to process an application.
One example of using only one statistic when two or more statistics are required to gain a fuller understanding of the actual situation. This is best shown in the example of employment within the United States. To better understand employment in the United States you need to know of the people who are without a job and looking for a job (The Unemployment Rate), and the people who are without a job and have given up looking for a job (The Underemployment Rate). Many people go back and forth between these categories, and you need to be aware of both rates to truly determine the employment rate within the United States. Very often the change in one rate influences a change in the other rate, and both rates are needed to determine employment within the United States. The following charts exemplify this:
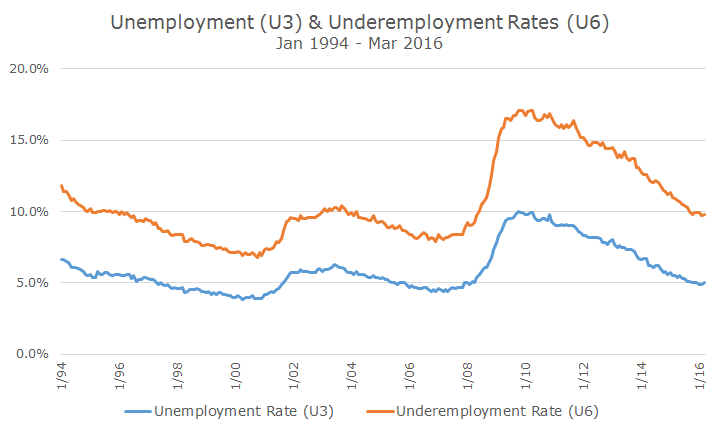
As can be seen in the above chart the number of people who are not working in the United States can vary between 10 and 20 percent. And it is important that we know the total number of people without work so that we can provide them with the proper social services (mostly food and housing) while they have no work. Combining these and other factors you get the Civilian Labor Force Participation Rate. This rate shows what percentage of the U.S. Population is currently employed as follows:
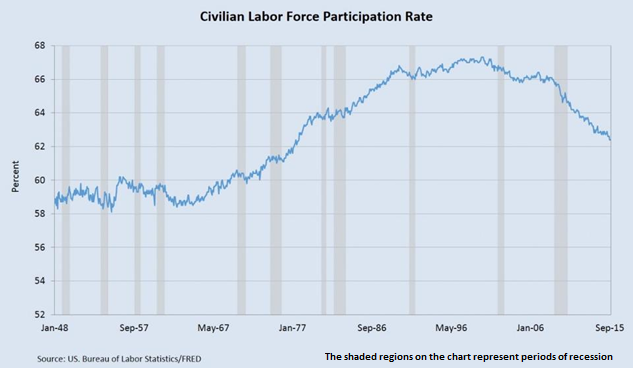
As can be seen from this chart you can obtain a better perspective of employment within the United States. This chart, of course, can be analyzed with additional statistics, and be broken down into finer detail for a more comprehensive analysis. You must be careful in obtaining the proper statistics to determine your objective. This becomes more apparent in the next observation.
Another example of the misuse of statistics is documented in the “AA Efficacy Rates” of my “Addiction” observation. Reading this carefully will demonstrate how difficult it is to gather data, processing the data, and analyzing the data properly. This is also a good example of both “Studies Show” and “Statistics Show”, and how it is possible to reach an incorrect conclusion without broader and fuller analysis of studies or statistics.
Using
Figures and Studies Inappropriately – Part III
Another example is a recent University of Iowa study of its students to determine What Men and Woman want in a life partner. They studied their students and gather statistics as to what their students wanted or didn’t want in in a partner. I have no doubt as to the veracity of this study, but I have serious doubts about the appropriateness of their conclusions. First the results of their study:

The first problem is that they polled their student body, a student body who has spent most of their life in an academic environment (K-12 & College). This study sample makes no allowance for non-academic experience in a normal social or work environment that we all know has a significant impact on our attitudes and values. Or as Mark Twain once said:
“When I was sixteen I thought that my father was the dumbest most ignorant man in the world. And when I turned twenty I was amazed how much he had learned in four short years.”
Therefore, this study was only appropriate for College students and has little bearing on what an adult may think after a few years in a normal environment.
The other problem with this study is that modern medical science knows that a human brain does not fully mature until sometime between the year's twenty-two and twenty-four. And the last part of the brain that develops is the center that makes judgments based on possible future consequences of your actions. That is why most young people behave in a wild and crazy manner – their brain has not developed sufficiently to control their actions. Therefore, this study is utilizing an immature brain as its sample group. Who knows what judgments may change after the brain is fully mature.
There is also the question of self-serving and bias answers. Did these students answer the questions the way they really think or the way they believed they should answer the question? Take the last category “Unimportant characteristics” as an example. The Chastity answer begs the question “Are the men answering this way to convince the woman that sexual promiscuity is acceptable?” and “Are woman answering this way to justify their own promiscuity?”. It would have been a much more meaningful statistic if it were broken down by students who were virgins, students with 1 to 3 sexual partners, students with 4-9 sexual partners, and students with ten or more sexual partners. Another criterion for the answer is that if one of the partners were much more promiscuous than the other would it make a difference. A breakdown of the sexuality of the students (heterosexual, homosexual male, homosexual female, bi-sexual, etc.) is also necessary. It should also be broken down by students that identify themselves by ideology (conservative, moderate, liberal, leftist), as well as religiosity (strongly religious, mildly religious, no religiosity, or atheistic). You could then judge the weight of this answer based on these backgrounds.
The “Similar political background” answer also needs to be broken down to students that identify themselves by ideology (conservative, moderate, liberal, leftist), as well as religiosity (strongly religious, mildly religious, no religiosity, or atheistic), and other possible categories.
The other categories also have the same types of questions as too self-serving and bias answers. Not having read the study (I couldn’t find the actual study, but I found the graphic being touted by special interest groups), I do not know if any of these items were broken down, and in which ways they were broken down (this is why a synopsis or simple graphic of a statistic is not a good basis for making a judgment).
To be truly useful this study also needs to have a follow-up of five, ten, fifteen, and twenty years after the original study was performed, with the original students who were studied. You could then study if they were married and/or divorced, had children, their socio-economic status, and other factors that may have changed their opinions. Such a study and follow-up would then be very useful to determine what men and woman really want.
Given the above, it can be seen that this study is only useful for people in a constricted environment (academics) with immature brains. It probably has little basis for a mature person with life experiences and a fully developed brain. As such it should only be utilized for analysis within its constricted study sample.
The Law of Unintended
Consequences
The law of Unintended Consequences is something that I have
been very concerned about, ever since I found out about it. I have
seen it operate so many times, and in so many ways, that although it
is an economic and social law (which are often highly inaccurate) I
believe that it is a cornerstons of economic and social science, and
very applicable to political science.
The law of unintended consequences, often cited but rarely defined, is that actions of people—and especially of government—always have effects that are unanticipated or unintended, in its outcomes of unexpected benefits, unexpected drawbacks, and perverse results. Economists and other social scientists have heeded its power for centuries; and for just as long, politicians and popular opinion have largely ignored it. Most often, however, the law of unintended consequences illuminates the perverse unanticipated effects of government legislation and regulation. This law is also a great contributor to the public policy aphorism “Every public policy problem has a simple solution – and it’s usually wrong.”
Unintended consequences can be grouped into three types:
- Unexpected benefit: A positive unexpected benefit (also referred to as luck, serendipity or a windfall).
- Unexpected drawback: An unexpected detriment occurring in addition to the desired effect of the policy (e.g., while irrigation schemes provide people with water for agriculture, they can increase waterborne diseases that have devastating health effects, such as schistosomiasis).
- Perverse result: A perverse effect contrary to what was originally intended (when an intended solution makes a problem worse). This is sometimes referred to as 'backfire'...
I would also add, upon thinking about the law of Unintended Consequences, that is very important to remember three things:
- That we know what we know,
- That we know what we don't know,
- That we don't know that we don't know.
It is that we don't know that we don't know that often is the killer in the Law of Unintended Consequences.
The percentages of these items are often staggering as follows:
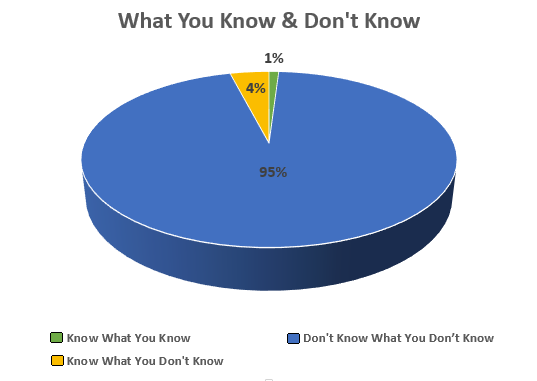
When crafting any social, economic, or political policy you should always remember what Ben Franklin said - “Doubt a little of your own infallibility” when crafting and reviewing the policy.
A good introduction to this topic is The Concise Encyclopedia of Economics article on Unintended Consequences.Common
Sense
Most people would resort to common sense when reviewing studies, statistics, and polls, but common sense can lead you astray. What most people mean by "Common Sense" is common knowledge and sensible responses. But common knowledge may not be so common amongst many people, or sensible responses may differ among reasonable people.
Common knowledge is not so common as each person has a different breadth and depth of knowledge. The knowledge, education, and experience of each person differ. As such, each person may reach a different conclusion than another person. This does not necessarily make someone wrong if they disagree with you. Most often if you politely discuss the disagreement you may often come to a common agreement, or modify your or the others opinion, or simply agree to disagree. But you should always keep in mind that you may be wrong, and you should be open to change your conclusion.
Sensible responses are different amongst people, as each person has their own priorities and judgments of the importance of an issue. Sometimes people place more importance on their personal goals, while others may place more importance on the social goals. And even within the goals, there are different priorities. They weigh the criteria to determine the sensible response, with each person putting different weights on each criterion, and then have a sensible response based on their criteria, which may (and possibly will) be different than another person's response. Until you discuss the criteria and weights you cannot know the reason for the other person's response. Therefore, do not be quick to judge another's response as it may be perfectly reasonable from the perspective of the other person. Again, politely discussing the response will help you better understand the other person.
Common sense is most appropriate in our social interactions with each other. We grow up and learn how to treat each other (such as politeness and common courtesies) within our cultural norms. This is one of the best purposes of common sense, and indeed we could not function as a society without this type of common sense. So, what do I mean by common sense in studies, statistics, and polls?
My personal usage of common sense in studies, statistics, and polls is to utilize my understanding of human nature and our cultural norms. I then obtain as much knowledge as possible from intelligent, knowledgeable and experienced subject matter experts (especially those that I may disagree with), and then apply formal and informal logic to what I have learned to reach my own conclusions. I also allow for the possibility that I may be wrong, and to try to determine the consequences of my being right or wrong. I then reach what I consider a reasonable conclusion on the sensibility of the studies, statistics, or polls. This is how I utilize Common Sense when reviewing studies, statistics, and polls.
Final Thoughts
Studies and statistics are often used and abused to justify a political or social point of view. They are, however, often used and abused in all arenas. Therefore, you should be wary of all studies and statistics until you can review them to ascertain their veracity. To do this you will need more knowledge than this article can provide. Statistics and Studies can be a dense and dry subject, but there is three books I would highly recommend as it it is very readable and enjoyable. These books are; "Naked Statistics: Stripping The Dread From The Data" By Charles Wheelan, "Studies Show: A Popular Guide To Understanding Scientific Studies” by John H. Fennick, and "The Art of Statistics: How to Learn from Data" by David Spiegelhalter. If you are interested in knowing more about statistics and studies than these books are for you.